Academy Awards
I have been curious to see if there is any correlation between the ages of award winners in comparison to their respective nominees in well-known award ceremonies. I wanted to initially try my chance with Academy Awards as there is plenty of easily accessible data, but this same idea could be easily applied to many other competitions. The interactive plot below compares the ages of nominees and winners of the Academy Awards for three categories.
Dataset and code to generate the plots can be found here. Plot is best viewed (and interacted with) in desktop. If the browser somehow does not display it correctly, you can run the notebook in the repository instead.
I used Plotly Python to generate the plot. You can select the dataset via the buttons on the left side and toggle shown data by clicking on the legend entries on the right side. Hovering over the scatter plot will show the details of the data entries.
More Plots!
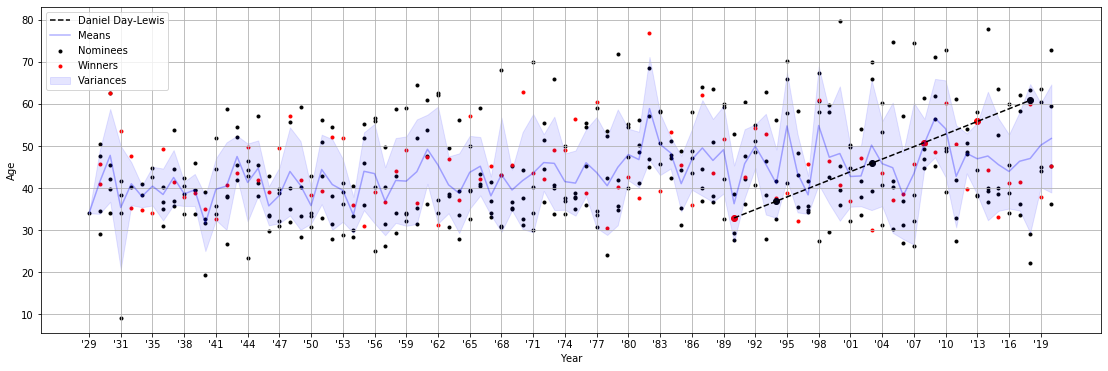
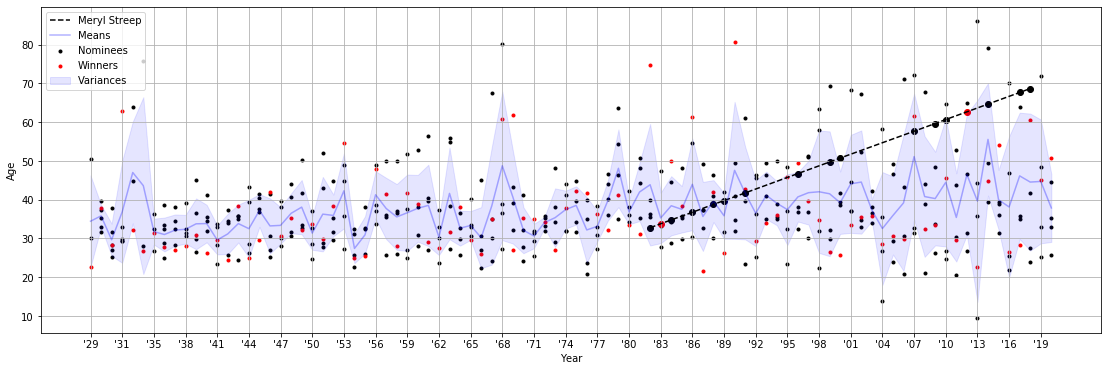
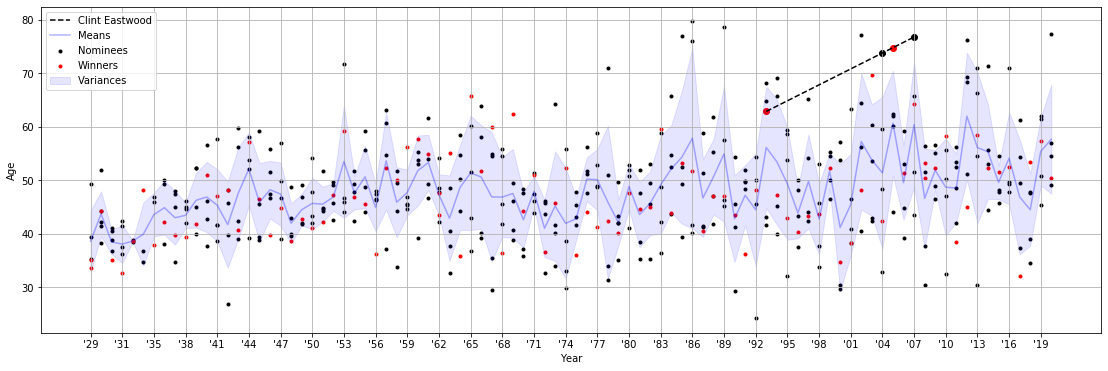
You can also run the notebook on Colab to draw trajectories for specific people. I have added a few examples below to illustrate.
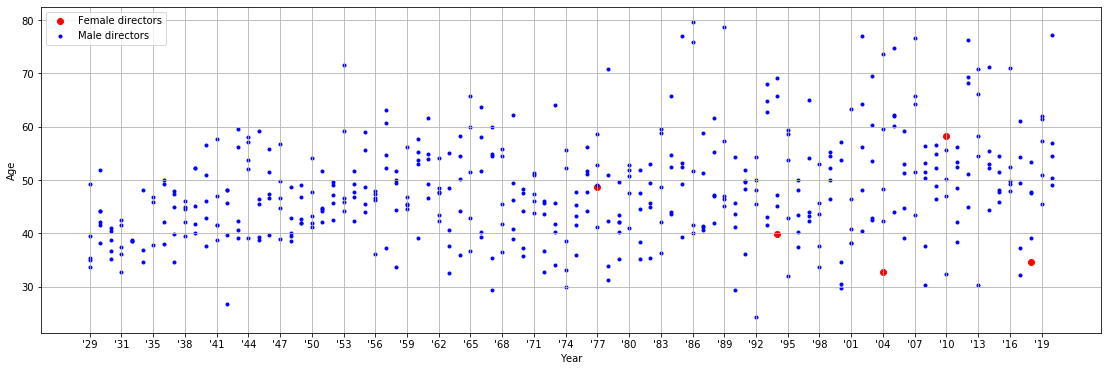
Academy just doesn’t recognize female directors
Each year a nomination for Meryl Streep
Clint Eastwood: 89 years and still going strong
I still can’t believe Day-Lewis is retired